Research Article
Volume 2 Issue 3 - 2018
Selection for Drought Tolerance Genotypes in Bread Wheat (Triticum Aestivuml.) Under in Vitro Conditions Based on Molecular Approaches
Institute of Genetic Engineering and Biotechnology for Post Graduate Studies, University of Baghdad, Iraq
*Corresponding Author: Kamil M AL-Jobori Lubna, Institute of Genetic Engineering and Biotechnology for Post Graduate Studies, University of Baghdad, Iraq.
Received: November 03, 2017; Published: January 03, 2018
Abstract
Drought is one of a major environmental factors affecting growth and yield of wheat in arid and semi-arid areas of the world, response of four genotypes of bread wheat (Triticum aestivum L.) to mature embryo culture, callus production and in vitro drought tolerance was used in a Completely Randomized Design (CRD) with ten replications. The effect of water stress induced by polyethylene glycol (PEG 6000). Whereas formed calli on MS medium supplemented with 4.0 mg/l of 2, 4- dichlorophenoxyacetic acid (2, 4-D) and 0.5 mg/l kinetin were sub cultured on media containing different concentrations of PEG (0.0, 50, 100, 150 and 200 g/l). DNA-based molecular markers DNA (RAPD) were used in this study to examine the genetic differences among four Iraqi wheat genotypes. Results showed that all primers, except for OPA-15 and VBC3-13, produced different-sized fragments with DNA from one or more of the tested genotypes. RAPD analysis detected a total of 92 DNA fragments of which 86 (93.5%) were polymorphic. The genotype Iba99 produced the highest total number of fragments (47), whereas the Dijlah produced the lowest number (30). Primer B-18 produced the highest number of bands (16). while the least number of bands (8) was recorded for primer VBC3-14. The amplified DNA fragments normally ranged from150bp to1600bp.The maximum polymorphism (100%) was recorded for the primers VBC2-6, VBC3-8 and VBC3-14, whilst the minimum polymorphism was produced by the primer B-18.Maximum numbers of unique DNA fragments (11) were detected in Dijlah genotype, whereas the minimum (2) were detected in Furat genotype. Investigation of genetic distance using RAPD analysis showed that the lowest genetic distance (0.40) 40% was obtained between Iba99 and Furat genotypes, while the highest genetic distance (0.79) 79% was observed between Dijlah and Sham6 genotypes. Analysis of genetic relationship showed there were three groups, the first included Iba99 and Furat. The second contained the genotype Sham6, and the most distant genotype (Dijlah) in the dendrogram stands in the third group. In conclusion, Construction of genetic relatedness tree can done using RAPD molecular marker, the use of molecular markers will be good alternative to the agronomic selection, where it allow a quick selection and provides the breeder with the genetic marker for drought stress. The results of this study can be used as database for Iraqi wheat genotypes to be used in the future development of new varieties in breeding programs.
Keywords: Bread wheat; Tissue Culture; PEG; Drought stress; RAPD
Introduction
Wheat (Triticum aestivum L.) is one of the most important cereals in the world and Iraq. However, Iraq still imports tons of wheat every year. Abiotic environmental factors are considered the main source for reduction of yield by 71% (Khan., et al. 2013). Any excess or deficit of the abiotic stress factors adversely affects the plant growth and productivity (Koyro., et al. 2012). Drought and salinity are widespread problems around the world, especially in the middle and south of Iraq. Water deficit stress, which can arise from many environmental conditions, including drought, salinity, and high temperature has adverse effects on the growth and yield of crops, Understanding the physiological, biochemical, and molecular mechanisms of drought tolerance is very important in development of selection and breeding strategies (Aliyev and Huseynova, 2014). In vitro culture of plant cells and tissues such as mature embryos and immature embryos has attracted considerable interest over recent years because it provides a means to study plant physiological and genetic processes and offers a potential to improve cultivars by increasing genetic variability and are considered to be an important complement to classical plant breeding methods (Sorkheh., et al. 2011).
In vitro selection technique has been used to improve abiotic environmental stresses such as cold hardiness, salt tolerance and drought tolerance (Zair., et al. 2003; Benderradji., et al. 2012; El Ameen, 2013). One of the screening techniques based on physiological traits is the use of various osmotica to induce stress in plant tissues. Germination in mannitol and polyethylene glycol (PEG) has been suggested for drought screening (Shabir, 2010; Geravandi., et al. 2011). PEG cannot cross embranes and cannot get into the cell to change its osmotic potential (Dragiiska., et al. 1996). It stimulates water deficit conditions in cultured cells in a manner similar to that observed in the cells of intact plants subjected to true drought conditions (Yao., et al. 2007). Callus culture are used as an in vitro technique for biochemical and physiological studies in response to stress at the cellular level (Liu., et al. 2006). Many researchers have used the in vitro culture of cells on media supplemented with PEG to study the mechanisms of drought tolerance and to utilize the somaclonal variation, as a source of variability to improve the drought tolerance (El-Shafey., et al. 2009; El Ameen, 2013; Hemaid., et al. 2013). The response of plants to different abiotic stresses in the field or in greenhouse conditions is often difficult to be analyzed, due to variable nature of these stresses that cannot be controlled, thus in vitro tissue culture-based tools have been allowed a deeper understanding of the physiology and biochemistry in comparison to plants cultured under adverse environmental conditions (Benderradji., et al. 2012). Mature embryos can be used as an efficient explants source in wheat tissue culture due to their high frequency for callus induction and plant regeneration capacity (Ozgen., et al. 1998).
One of the main phenomena occurring in the cell during water shortage is extensive modification of gene expression (Liu., et al. 2013; Savitri., et al. 2013). Therefore, through a variety of molecular and biochemical approaches, key genes responsible for drought resistance were studied (Wei., et al. 2009). Randomly amplified polymorphic DNA primers (RAPD) is one of the most widely used molecular techniques to detect polymorphism among accessions of different plant species (Shiran., et al. 2007). RAPD associated with drought tolerance was used initially to search genetic diversity in wheat plants (El Ameen, 2013). RAPD technology is an important tool for rapid identification of markers associated with drought resistance and is very effective in determining the genetic variation among wheat genotypes (Ali., et al. 2013). The RAPD technique has been widely applied in studies of wheat genetic diversity (Iqbal., et al. 2007). Soliman and Headway (2013) used RAPD-PCR with four primers to distinguish plantlets with regenerated from the PEG tolerant and control plantlets, four bread wheat genotypes and one wheat line were evaluated for molecular indicators of drought tolerance using RAPD-PCR, and found that RAPD analysis is a valuable diagnostic tool when different sets of RAPD primers were used to study the polymorphism at the molecular level (ElSayed and Rafudeen, 2012). The results of (El Ameen, 2013) indicate that tolerant wheat genotypes harbored seven positive RAPD markers, while sensitive genotypes had only one negative RAPD markers. Hence the objective of the present investigations to evaluate the ability of genotypes to induce callus using mature embryo culture and screening bread wheat genotypes for drought tolerance under in vitro condition using different concentrations of PEG and test RAPD markers associated with tolerant calli.
Materials and Method
Plant Materials
This study was carried out in the Tissue Culture Laboratory, Institute of Genetic Engineering and Biotechnology for postgraduate Studies, University of Baghdad, Iraq. Grains of four bread wheat (Triticumaestivum L.) genotypes (Sham-6, Dijlah, Furat and Iba 99) were obtained from Seed Testing and Certification Center - AbuGraib/Ministry of Agriculture, the genotype and their pedigree are presented in table 1. Mature embryos of these genotypes were cultured on callus induction medium to obtain calli which were used for DNA extraction.
This study was carried out in the Tissue Culture Laboratory, Institute of Genetic Engineering and Biotechnology for postgraduate Studies, University of Baghdad, Iraq. Grains of four bread wheat (Triticumaestivum L.) genotypes (Sham-6, Dijlah, Furat and Iba 99) were obtained from Seed Testing and Certification Center - AbuGraib/Ministry of Agriculture, the genotype and their pedigree are presented in table 1. Mature embryos of these genotypes were cultured on callus induction medium to obtain calli which were used for DNA extraction.
| Genotype | Pedigree |
| Dijla | F2 materials derived from a commercial wheat breeding program, USA→ (radiation) |
| Furat | F2 materials derived from a commercial wheat breeding program, USA→ (radiation) |
| Iba99 | Ures/Bow s / 3/Jup/Biy s /ures |
| Sham6 | W3918A/JUP |
Table 1: The genotypes and their pedigree used in this study.
Callus Induction
After separation of the mature embryos from ripe grains in a laminar flow hood by using a sterilized metallic scalpel and forceps they were inoculated in the callus induction media (Murashige and Skoog, 1962) supplemented with 4.0 mg/l 2, 4-D, and one embryo per vial with 100 replication for all cultivars respectively. The pH of themedium was adjusted to 5.7 prior to autoclaving at 121°C for 20 min. The scutellums side were kept upward and maintained at 25 ± 1°C temperatures in complete darkness for four weeks for callus induction. During the entire period of inoculation the autoclaved scalpels, forceps, were dipped in 90% absolute alcohol contained in a glass beaker inside the cabinet and flaming the scalpel and forceps with a burner (Bunzen burner) and both the hands were rinsed with 70% ethyl alcohol. All measures were taken to obtain maximum free condition from contamination during the operation. Afterward, induced calli were shifted to callus multiplication media (MS2) supplemented with 4 mg/l 2, 4-D, and 0.5 mg/l kinetin for another period of four weeks. The culture media were refreshed every14 days.
After separation of the mature embryos from ripe grains in a laminar flow hood by using a sterilized metallic scalpel and forceps they were inoculated in the callus induction media (Murashige and Skoog, 1962) supplemented with 4.0 mg/l 2, 4-D, and one embryo per vial with 100 replication for all cultivars respectively. The pH of themedium was adjusted to 5.7 prior to autoclaving at 121°C for 20 min. The scutellums side were kept upward and maintained at 25 ± 1°C temperatures in complete darkness for four weeks for callus induction. During the entire period of inoculation the autoclaved scalpels, forceps, were dipped in 90% absolute alcohol contained in a glass beaker inside the cabinet and flaming the scalpel and forceps with a burner (Bunzen burner) and both the hands were rinsed with 70% ethyl alcohol. All measures were taken to obtain maximum free condition from contamination during the operation. Afterward, induced calli were shifted to callus multiplication media (MS2) supplemented with 4 mg/l 2, 4-D, and 0.5 mg/l kinetin for another period of four weeks. The culture media were refreshed every14 days.
In vitro Selection Procedure of Drought Tolerant Callus.
After four weeks of incubation on callus multiplication media, Healthy calli were separately sub cultured in MS2 medium supplemented with different concentrations of polyethylene glycol (PEG 6000) (0, 50, 100, 150, 200 g/l).
After four weeks of incubation on callus multiplication media, Healthy calli were separately sub cultured in MS2 medium supplemented with different concentrations of polyethylene glycol (PEG 6000) (0, 50, 100, 150, 200 g/l).
PEG-6000 solutions of (-0.50,-1.48, -2.95, -4.91 Bars was prepared according to the method of Michel and Kaufmann (1973) :
OP = (-1.18 × 10⁻²) × C - (1.18 × 10⁻⁴) × C+ (2.67 x 10⁻⁴) × CT +
(8.39 x l0-7) × C2T
Where OP = the osmotic pressure
C = PEG concentration
T = Temperature.
The concentration of the PEG 6000 and their osmotic pressure are illustrated in table 2.
OP = (-1.18 × 10⁻²) × C - (1.18 × 10⁻⁴) × C+ (2.67 x 10⁻⁴) × CT +
(8.39 x l0-7) × C2T
Where OP = the osmotic pressure
C = PEG concentration
T = Temperature.
The concentration of the PEG 6000 and their osmotic pressure are illustrated in table 2.
| PEG6000 g/kg | Bars of OP at 25°C |
| 50 | -0.50 |
| 100 | -1.48 |
| 150 | -2.95 |
| 200 | -4.91 |
Table 2: The osmotic pressure (OP) of the PEG 60000 concentration.
Primer Selection
Ten random primers (decamer) were used in this study to detect genetic polymorphism at DNA level in four genotypes of bread wheat. The primers were supplied by Bioneer Company (Korea). The sequence of RAPD primers were shown in table 3.
Ten random primers (decamer) were used in this study to detect genetic polymorphism at DNA level in four genotypes of bread wheat. The primers were supplied by Bioneer Company (Korea). The sequence of RAPD primers were shown in table 3.
| Primer name | PCR RAPD primers sequences (5'–3') | References |
| OPA-15 | TTCCGAACCC | Khaled., etal. (2015) |
| E - 10 | CACCAGGTGA | El Ameen (2013) |
| B-18 | CCACAGCAGT | ElSayed and Rafudeen (2012) |
| VBC 3-13 | AAGCCTCGTC | Jerodieh., et al. (2015) |
| VBC 2-6 | TGCTCTGCCC | |
| VBC 3-2 | GTGAGGCGTC | |
| VBC 3-8 | TGGACCGGTG | |
| VBC 3-9 | CTCACCGTCC | |
| VBC 3-14 | TGCGTGCTTG | |
| VBC 3-20 | ACTTCGCCAC |
Table 3: The sequence of the 10-base nucleotide primers used for rapd analysis.
DNA extraction
In this study, DNA was extracted from callus tissues without the use of liquid nitrogen, the aim of using liquid nitrogen is to broken the cell wall. Since callus tissues are soft and freshly, the cell wall can be broken by crushing and grinding the sample into a fine paste using a sterile pestle and mortar, DNA was extracted by using genome DNA purification kit (Geneaid/korea). DNA concentration and purity were assessed by the use of nanodrop.
In this study, DNA was extracted from callus tissues without the use of liquid nitrogen, the aim of using liquid nitrogen is to broken the cell wall. Since callus tissues are soft and freshly, the cell wall can be broken by crushing and grinding the sample into a fine paste using a sterile pestle and mortar, DNA was extracted by using genome DNA purification kit (Geneaid/korea). DNA concentration and purity were assessed by the use of nanodrop.
Polymerase Chain Reaction (PCR)
After checking the concentration of genomic DNA by agarose gel electrophoresis for all four wheat genotypes which will use to detect a marker related to drought tolerance. Out of the 10 random primers screened, only eight primers clear reproducible bands. The PCR mixture (25 μl total) consisted of 12 μl PCR pre Mix (Ready to use): Taq DNA polymerase, dNTPs, MgCl2 and reaction buffer (PH 8.5), 5 μl of primers,3 μl DNA template and 5 μl nuclease free water. Amplification was carried using a program that consisted of initial denaturation for 5 min. at 95°C, followed by 35 cycle of 1 min at 95°C, 45s at 37°, and 1 min at 72°C, and final extension for 7 min at 72°C.
After checking the concentration of genomic DNA by agarose gel electrophoresis for all four wheat genotypes which will use to detect a marker related to drought tolerance. Out of the 10 random primers screened, only eight primers clear reproducible bands. The PCR mixture (25 μl total) consisted of 12 μl PCR pre Mix (Ready to use): Taq DNA polymerase, dNTPs, MgCl2 and reaction buffer (PH 8.5), 5 μl of primers,3 μl DNA template and 5 μl nuclease free water. Amplification was carried using a program that consisted of initial denaturation for 5 min. at 95°C, followed by 35 cycle of 1 min at 95°C, 45s at 37°, and 1 min at 72°C, and final extension for 7 min at 72°C.
Results and Discussion
Callus Induction and Growth
Mature embryos were cultured on MS medium supplemented with 4.0 mg/l 2, 4-D for four wheat genotypes and incubated in darkness at 25 ± 1°C for four weeks (Figure 1A). 2, 4-D was reported as the most widely used growth regulator for callus induction and maintenance in wheat). Good callus growth was observed on MS medium containing 4 mg/l 2, 4-D, and these results are consistent with the findings of Hemaid., et al. (2013). But differ from the results of other researchers (Yu., et al. 2008; Salama., et al. 2013) who reported that wheat callus induction frequency peaked with 2.0 mg/l 2, 4-D in the induction medium. Induced calli were shifted to callus multiplication (Callus proliferation) on MS medium supplemented with 4.0 mg/l 2, 4-D, 0.5 mg/l kinetin, for 4 weeks (Figure 1B). Solid MS medium was optimum for mature embryo culture of wheat supplement with different combinations of plant growth regulators (Mendoza and Kaeppler, 2002).
Mature embryos were cultured on MS medium supplemented with 4.0 mg/l 2, 4-D for four wheat genotypes and incubated in darkness at 25 ± 1°C for four weeks (Figure 1A). 2, 4-D was reported as the most widely used growth regulator for callus induction and maintenance in wheat). Good callus growth was observed on MS medium containing 4 mg/l 2, 4-D, and these results are consistent with the findings of Hemaid., et al. (2013). But differ from the results of other researchers (Yu., et al. 2008; Salama., et al. 2013) who reported that wheat callus induction frequency peaked with 2.0 mg/l 2, 4-D in the induction medium. Induced calli were shifted to callus multiplication (Callus proliferation) on MS medium supplemented with 4.0 mg/l 2, 4-D, 0.5 mg/l kinetin, for 4 weeks (Figure 1B). Solid MS medium was optimum for mature embryo culture of wheat supplement with different combinations of plant growth regulators (Mendoza and Kaeppler, 2002).
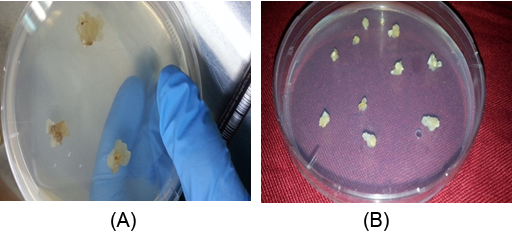
Figure 1(A): Callus formation of wheat after 1 week from inoculation on induction medium which containing MS + 4.0 mg/l 2,4-D.
(B): callus at proliferation period after growing on multiplication medium containing 4.0 mg/l 2,4-D and 0.5 mg/l kinetin.
(B): callus at proliferation period after growing on multiplication medium containing 4.0 mg/l 2,4-D and 0.5 mg/l kinetin.
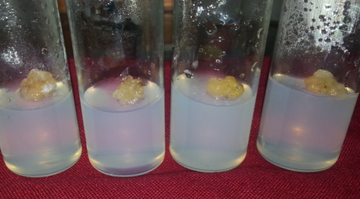
The callus was growing on callus MS2 medium with different concentrations of PEG for four weeks (Figures 2, 3). The addition of PEG in the medium leads to a loss of cell turgor and hence a loss of growth. The growth of the calli is significantly restricted by increasing and continuous presence of PEG in the media (Dragiiska., et al. 1996). Levitt (1980) stated that at the cellular level, the effect of water stress on the retard of cell divisions and elongation by the loss of turgor, and loss of growth (Hemaid., et al. 2013).
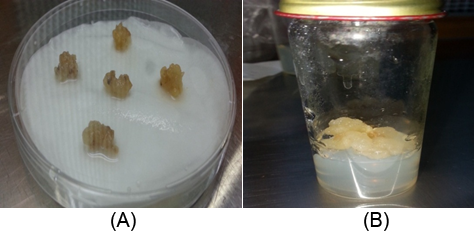
Figure 3(A): Callus grown on MS liquid medium with filter paper bridges as carrier for the 100, 150, 200 concentration of PEG.
(B): Callus without stress condition.
(B): Callus without stress condition.
Molecular Genetic Marker
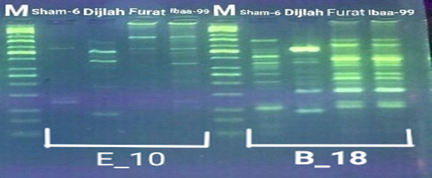
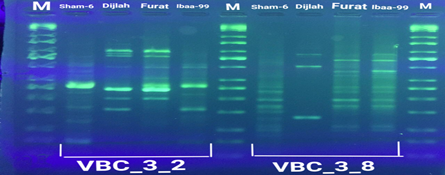
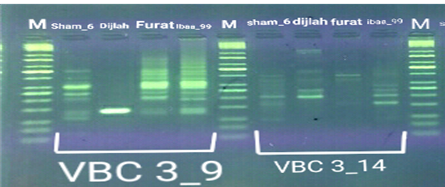
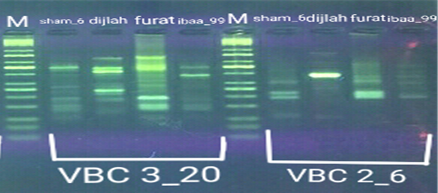
In the four wheat genotypes 92 DNA fragments were detected giving an average of 23 alleles per genotype. The number of fragments generated for each primer and for each genotype ranged from 1 to 16. The genotype Iba99 produced the highest total number of fragments (47), whereas the Dijlah produced the lowest number (30). Primer B-18 produced the highest number of bands (16) followed by VBC3-2 (13), VBC3-8 andVBC3-2 which produced 12 bands each, E-10 and VBC3-9 which produced 11 bands each, VBC2-6(9). The least number of bands (8) was recorded for primer VBC3-14 (Figure 4-7). The amplified DNA fragments normally ranged from150bp to 1600bp. ElAmeen (2013) reported that E-10Marker could be considered as reliable marker for drought tolerant in wheat.
In the four wheat genotypes 92 DNA fragments were detected giving an average of 23 alleles per genotype. The number of fragments generated for each primer and for each genotype ranged from 1 to 16. The genotype Iba99 produced the highest total number of fragments (47), whereas the Dijlah produced the lowest number (30). Primer B-18 produced the highest number of bands (16) followed by VBC3-2 (13), VBC3-8 andVBC3-2 which produced 12 bands each, E-10 and VBC3-9 which produced 11 bands each, VBC2-6(9). The least number of bands (8) was recorded for primer VBC3-14 (Figure 4-7). The amplified DNA fragments normally ranged from150bp to 1600bp. ElAmeen (2013) reported that E-10Marker could be considered as reliable marker for drought tolerant in wheat.
In this study RAPDs detected a high degree of polymorphism among studied genotypes. From the 92 fragments detected, with all primers, in the four wheat genotypes 86 (93.5%) were polymorphic with 10.8 polymorphic bands per primer on average. Different percentages of polymorphism in the range of 87.5-100% were obtained by the primers used in this study (Table 4). It is generally reported that polymorphism among genotypes can arise through nucleotide changes that prevent amplification by introducing a mismatch at one priming site; deletion of a priming site; insertions that render priming site too distant to support amplification and insertions or deletions that change the size of the amplified product (Powell., et al. 1996).
| No. | Primers | Total number of main bands | Number of polymorphic bands | Polymorphism (%) |
| 1 | E-10 | 11 | 10 | 90.9 |
| 2 | B-18 | 16 | 14 | 87.5 |
| 3 | VBC3-2 | 13 | 12 | 92.3 |
| 4 | VBC3-8 | 12 | 12 | 100 |
| 5 | VBC3-9 | 11 | 10 | 90.9 |
| 6 | VBC3-14 | 8 | 8 | 100 |
| 7 | VBC3-20 | 12 | 11 | 91.7 |
| 8 | VBC2-6 | 9 | 9 | 100 |
| total | 92 | 86 | Mean = 93.5 |
Table 4: Polymorphism rate for the four wheat genotypes using random primers.
The maximum polymorphism (100%) was recorded for the primers VBC2-6, VBC3-8 and VBC3-14, whilst the minimum polymorphism was produced by the primer B-18. The polymorphism obtained in this study (93.5%) were similar with the results of Jerodieh., et al. (2015) who used the same primers that used in this study and found 93.8% polymorphic. However, the polymorphism obtained in this study are comparatively high when compared with the results obtained by Nimbal., et al. (2009) who reported 80% polymorphism for bread wheat. Ahmed., et al. (2010) observed 61% polymorphism for 32 wheat genotypes using 15 RAPD primers. ElSayed and Rafudeen (2012) stated that a total of 72 alleles were amplified with six random primers out of which 61% were monomorphic and 38% were polymorphic. Tonk., et al. (2014) showed that of 145 bands70 (41.28%) were polymorphism. Shukre., et al. (2015) reported polymorphism were 12.5-80.76% for wheat genotypes. Sabbour., et al. (2015). The different primers revealed different levels of polymorphism among the four studied wheat genotypes. This corresponds to a level of polymorphism of 63.7%. The use of considerable and high polymorphic DNA markers eliminates the limitations associated with morphological and biochemical characterization, especially for closely related varieties (Schulman, 2007).
Unique DNA fragments with different sizes were detected in a particular genotype but not in the others (Table 5). In this respect, the 8 unique DNA fragment of 950 and 800 bp length (B-18), 340,250and 150 bp (VBC3-2), 300bp (VBC3-8)220bp (VBC3-9) and 500 bp (VBC3-20) were unique positive markers to the genotype Sham6. The 11 bands780, 500,370 and 160bp (E-10), 180bp (B-18), 1100bp (VBC3-2), 800 and 260bp (VBC3-8), 1100bp (VBC3-14) and900 and 450bp (VBC3-20) were positive markers for genotype Dijlah. A 2DNA fragment of 1600 bp (VBC3-9) and 600bp (VBC3-20) were a unique positive marker to genotype Furat. The 3DNA fragment having a size of 700 and400 bp, and 800bp which were amplified by the primers E-10 and VBC3-14, respectively, were unique to genotype Iba99. Results revealed that DNA markers E-10 and VBC3-14 exhibited no unique band for the genotypes Sham6 and Furat. DNA markers E-18 and VBC3-2 were exhibited no unique band for the genotypes Furat and Iba99. DNA marker VBC3-9 exhibited no unique band for the genotypes Dijlah and Iba99.whereas DNA marker VBC3-20 exhibited no unique band for the genotype Iba99. However no negative markers were recorded for all genotypes Figures (4-7). The results obtained demonstrated that the RAPD assay have a considerable potential for identification and recognition of different wheat cultivars. Such potentiality has also been highlighted by Tonk et al. (2014).
| Genotypes names | Primers names | unique bands (bp) | numbers of unique bands | Total |
| Sham6 | B-18 | 950,800 | 4th, 5th | 8 |
| VBC3-2 | 340,250,150 | 10th, 12th, 13th | ||
| VBC3-8 | 300 | 9th | ||
| VBC3-9 | 220 | 11th | ||
| VBC3-20 | 500 | 7th | ||
| Dijlah | E-10 | 780,500,370,160 | 5th, 7th, 9th, 11th | 11 |
| B-18 | 180 | 11th | ||
| VBC3-2 | 1100 | 2nd | ||
| VBC3-8 | 800,260 | 3rd, 10th | ||
| VBC3-14 | 1100 | Ist | ||
| VBC3-20 | 900, 450 | 3rd, 8th | ||
| Furat | VBC3-9 | 1600 | Ist | 2 |
| VBC3-20 | 600 | 5th | ||
| Iba99 | E-10 | 700, 400 | 6th, 8th | 3 |
| VBC3-14 | 800 | 4th |
Table 5: Wheat genotypes and primers that appeared unique bands of genotypes, unique bands (bp) and numbers of these bands.
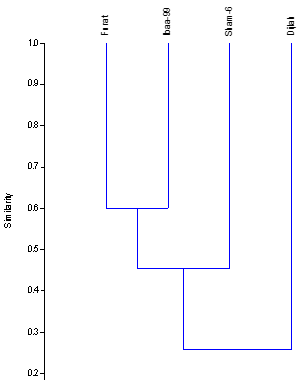
The genetic distance (RAPD-GD) of the 4 wheat genotypes, based on the data of 8 RAPD primers was calculated using genetic program (PAST program Ver.1.91 (Hammer., et al. 2001), and based on the similarity scale Hamming similarity index). Table 6 illustrates the values of genetic distance of wheat genotypes. The RAPD-GD value ranged from (0.40) to (0. 79). The lowest genetic distance (0.40) 40% was obtained between Iba99 and Furat genotypes indicating that these are relatively less variable, while the highest genetic distance (0.79) 79% was observed between Dijlah and Sham6 genotypes.
| Sham-6 | Dijlah | Furat | Ibaa-99 | |
| Sham-6 | 0 | 0.79 | 0.51 | 0.58 |
| Dijlah | 0.79 | 0 | 0.68 | 0.75 |
| Furat | 0.51 | 0.68 | 0 | 0.4 |
| Ibaa-99 | 0.58 | 0.75 | 0.4 | 0 |
Table 6: Values of genetic distance between wheat genotypes based on RAPD data.
Dendrogram was constructed the genetic distance using UPGMA cluster analysis and depicted genetic relationships among four wheat genotypes, as clear from in Figure 8, wheat genotypes are grouped into three clusters. Cluster a included genotypes Iba99 and Furat, cluster B included Sham6 and the most distant genotype (Dijlah) in the dendrogram stands in cluster c. The closest genotypes were Iba99 and Furat (60%), while genotype Dijlah was the most diverse and have a low similarity (21%) when compared with other genotypes. Shukre., et al. (2015(reported that the value of similarity coefficient ranged from 0.088 to 9999.00. Sabbour., et al. (2015) reported that genetic similarity matrices among the four wheat genotypes showed that the range of pair similarity coefficient between genotypes was from 62.65 to 91.95. Al-Kaab., et al. (2016) indicated that the Similarity coefficient among sixteen Iraqi varieties depending on twenty seven RAPD primers ranged from 0.339 to 0.983.
Conclusions
In vitro tissue culture could be an important means of improving crop tolerance through genetic transformation as well as by induced somaclonal variation. The results of this study indicated that effect of callus selection media comprising PEG-6000 induced drought stress on callus growth rate for screening drought tolerant callus lines of wheat genotypes. Also, the results showed that all wheat genotypes were not always identical in their DNA ability to be amplified. RAPD analysis showed good potentiality to determine phylogenetic relationships among wheat genotypes. Construction of genetic relatedness tree can done using RAPD molecular marker, the use of molecular markers will be good alternative to the agronomic selection, where it allow a quick selection and provides the breeder with the genetic marker for drought stress.
References
- Ahmed MF., et al. “Assessment of genetic diversity among Pakistani wheat (TriticumaestivumL.) advanced breeding lines using RAPD and SDS-PAGE.Electron”. Journal of Biotechnology 13.3 (2010): 1-2.
- Ali A., et al.“Morphological and genetic diversity of Pakistani wheat germplasm under drought stress”. International Journal of Advancements in Research and Technology 2.5 (2013): 186-193.
- Aliyev JA and Huseynova IM. “Genotypic variation for drought tolerance in wheat plants”. Improvement of Crops in the Era of Climatic Changes 2 (2014): 151-169.
- Al Kaab DH., et al.“Estimation of the degree of diversity for some Iraqi wheat varieties through ISSR, SRAP and RAPD markers”. American Journal of Experimental Agriculture 11.3 (2016): 1-11.
- Benderradji L., et al. “Callus induction, proliferation, and plantlets regeneration of two bread wheat (Triticum aestivum L.) genotypes under saline and heat stress conditions”. ISRN Agronomy (2012): 367851.
- Dragiiska R., et al.“In vitro selection for osmotic tolerance in alfalfa (Medicago sativa L.)”. Bulgarian Journal of Plant Physiology 22.3-4 (1996): 30-39.
- El Ameen T. “Molecular markers for drought tolerance in bread wheat”. African Journal of Biotechnology 12.21 (2013): 3148-3152.
- El Sayed AI and Rafudeen MS. “Molecular Marker Assisted for recognition drought tolerant in some of bread wheat genotypes”. Journal of Crop Science and Biotechnology 15.1 (2012): 17-23.
- El Shafey., et al. “Pre-exposure to gamma rays alleviates the harmful effect of drought on the embryo-derived rice calli”. Australian Journal of Crop Science 3.5 (2009): 268-277.
- Geravandi M., et al.“Evaluation of some physiological traits as indicators of drought tolerance in bread wheat genotypes”. Russian Journal of Plant Physiology 58.1 (2011): 69-75.
- Hammer D., et al. “PAST: Palaeontological Statistics”. (2001):
- Hemaid I., et al.“Selection for drought tolerance genotypes in durum wheat (Triticum durum Desf.) under In vitro conditions”. Middle-East Journal of Scientific Research 14.1 (2013): 69-78.
- Khaled AGA., et al.“Identification of ISSR and RAPD markers linked to yield traits in bread wheat under normal and drought conditions”. Journal of Genetic Engineering and Biotechnology 13.2 (2015): 243-252.
- Khan MA., et al. “Recent advances in molecular tool development for drought tolerance breeding in cereal crops: a review”. Zemdirbyste-Agriculture 100.3 (2013): 325-334.
- Koyro HW., et al. “Abiotic Stress Responses in Plants: An Overview. In: "Environmental Adaptations and Stress Tolerance of Plants in the Era of Climate Change". P Ahmad and M.N.V. Prasad (eds.), Springer Science + Business Media: USA (2012): 1-28.
- Iqbal A., et al. “Study of genetic divergence among wheat genotypes through random amplified polymorphic DNA”. Genetics and Molecular Research6.3 (2007): 476-481.
- Jerodieh N., et al. “Genetic studies of some local syrian bread wheat using RAPD”. Syrian Journal of Agricultural Research 2.1 (2015): 32-40.
- Levitt J. “Responses of plants to environmental stresses. Vol. II. Water, radiation, salt, and other stresses”. Academic Press: New York (1980):
- Liu P., et al.“A wheat PI4K gene whose product possesses threonine auto phosphorylation activity confers tolerance to drought and salt in Arabidopsis”. Journal of Experimental Botany 64.10 (2013): 2915-2927.
- Liu T., et al. “Polyamine biosynthesis of apple callus under salt stress: Importance of arginine decarboxylase pathway in sress response”. Journal of Experimental Botany 57.11 (2006): 2589-2599.
- Mendoza MG and Kaeppler HF. “Auxin and sugar effects on callus induction and plant regeneration frequencies from mature embryos of wheat embryos”.In Vitro Cellular and Developmental Biology – Plant 38.1 (2002): 39-45.
- Michel BE and Kaufmann MR. “The osmotic potential of polyethylene glycol 6000”. Plant physiology 51.5 (1973): 914-916.
- Murashige T and Skoog F. “A revised medium for rapid growth and bioassays with tobacco tissue cultures”. Physiologia Plantarum 15.3 (1962): 473-497.
- Nimbal S., et al. “RAPD analysis for genetic polymorphism in bread wheat (Triticumaestivum L.emThell) genotypes varying for grain protein content”. The South Pacific Journal of Natural Science 27 (2009): 49-56.
- zgen M., et al.“Callus induction and plant regeneration from immature and mature embryos of winter durum wheat genotypes”. Plant Breeding 115.6 (1996): 455-458.
- Powell W., et al. “The comparison of RFLP, RAPD, AFLP andSSR (microsatellite) markers for germplasm analysis”. Molecular Breeding 2.3 (1996): 225-238.
- Sabbour AM., et al. “Genetic diversity among some wheat (Triticumaestivu L.) genotypes as revealed by RAPD and SSR analyses”. Journal of Agriculture and Environmental Sciences 15.10 (2015): 2069-2075.
- Salama EA., et al.“Embryo callus induction and regeneration of some Egyptian wheat cultivars”. Research Journal of Agriculture and Biological Sciences 9.2 (2013): 96-103.
- Savitri ES., et al.“Identification and characterization drought tolerance of gene LEA-D11 soybean (Glycine max L. Merril) based on PCR-sequencing”. American Journal of Molecular Biology 3 (2013): 32-37.
- Shabir HW., et al.“In vitro screening of rice (Oryza sativa L) callus for drought tolerance”. Communication in Biometry and Crop Science 5.2 (2010): 108‐115.
- Shiran B., et al.“Molecular characterization and genetic relationship among almond cultivars assessed by RAPD and SSR markers”. Scientia Horticulturae 111.3 (2007): 280-292.
- Shukre VM., et al.“Assessment of Genetic diversity among wheat varieties in aurangabad using RAPD analysis”. International Journal of Current Microbiology and Applied Sciences 4.8 (2015): 671-694.
- Schulman AH. “Molecular markers to assess genetic diversity”. Euphytica158.3 (2007): 313-321.
- Soliman HIA and Hendawy MH. “Selection for drought tolerance genotypes in durum wheat (Triticum durum Desf.) under in vitro conditions”. Middle-East Journal of Scientific Research 14.1 (2013): 69-78.
- Sorkheh K., et al. “In vitro assay of native tolerance in alfalfa (Medicago sativa)”. Bulgarian Journal of Plant Physiology 22 (2011): 30‐39.
- Tonk FA., et al.“Evaluation and comparison of ISSR and RAPD markers for assessment og genetic diversity in triticale genotypes”. Bulgarian Journal of Agricultural Science 20.6 (2014): 1413-1420.
- Wei B., et al. “Dreb1 genes in wheat (Triticum aestivum L.): development of functional markers and gene-mapping based on SNPs”. Molecular Breeding 23 (2009): 13-22.
- Yao M., et al. “Effect of mannose on callus induction and growth of different explants derived from wheat”. Journal of Triticeae Crops 27 (2007): 7-11.
- Yu Y., et al.“Optimization of mature embryo-based high frequency callus induction and plant regeneration from elite wheat cultivars grown in China”. Plant breeding127.3 (2008): 249-255.
- Zair I., et al. “Salt tolerance improvement in some wheat cultivars after application of in vitro selection Pressure”. Plant Cell Tissue and Organ Culture 73.3 (2003): 237-244.
Citation:
Kamil M AL-Jobori Lubna and HN AL-Tamemy. “Selection for Drought Tolerance Genotypes in Bread Wheat (Triticum Aestivuml.)
Under in Vitro Conditions Based on Molecular Approaches”. Innovative Techniques in Agriculture 2.3 (2018): 383-394.
Copyright: © 2018 Kamil M AL-Jobori Lubna and HN AL-Tamemy. This is an open-access article distributed under the terms of the Creative Commons Attribution License, which permits unrestricted use, distribution, and reproduction in any medium, provided the original author and source are credited.


 Scientia Ricerca is licensed and content of this site is available under a Creative Commons Attribution 4.0 International License.