Research Article
Volume 1 Issue 2 - 2017
Fish Imports and Their Contribution towards Feeding an Ever-Growing Population in Zambia
1The Copperbelt University, Kapasa Makasa University Campus, Chinsali, Zambia
2Department of Fisheries, Chilanga
2Department of Fisheries, Chilanga
*Corresponding Author: Confred G. Musuka, The Copperbelt University, Kapasa Makasa University Campus, Chinsali, Zambia.
Received: June 26, 2017; Published: August 11, 2017
Abstract
A study was conducted using structured questionnaires and personal interviews to determine how imported fish contributes towards reduction of fish deficit in Zambia. Data was collected from those involved in fish imports through two entry points into Zambia; namely Chirundu and Katima Mulilo, as well as the Department of Fisheries (DOF) headquarters in Chilanga. The site selection was based on the anticipated high level of fish imports coming from the Southern part of Zambia. This study has shown that the country imports up to 12% of all the fish consumed in Zambia, despite production from aquaculture having increased from 10 to 24%. The study further revealed that imported fish were of different preservation forms; Sun-died, Smoked, Salted, Frozen and chilled to prolong their shelf life. Frozen form constituted the largest amount, followed by salted and then chilled form. In terms of size preference, small fish of about 50g to 100g were mostly on demand in places of high population density. At the time of the study Katima Mulilo was very active, recording a monthly average of 1000 tonnes of fish imports, surpassing, Chirundu border post that used to lead in terms of imported fish into Zambia. In the same vein Siavonga was probably being used as an alternative route from Zimbabwe, although the Department of Fisheries was not very keen to collect fish import data. These imports cost Zambia a lot of money. To date imports have gone up five-fold over the last six to ten years. Just as so much fish was being imported into Zambia, the country had in the same vein recorded exports of both edible and ornamental fish to other countries where it earns some foreign exchange.
Keywords: Fish Imports; Ever increasing; Human Population; Contribution; Demand; Zambia
Introduction
Fish is very important to the developing world population as it is the major source of cheap high quality animal proteins which are very vital for healthy development (Ayoola, 2010). A portion of 150g of fish can provide about 50-60 percent of an adult’s daily protein requirements (FAO, 2014). Fish proteins can represent a crucial nutritional component in some densely populated countries where total protein intake levels may be low (FAO, 2014).
Fish is the second choice of animal protein after chicken and comprises a greater percentage of Zambia’s protein supply than it does in the rest of Africa and the developing world (CSO SUN, 2014). Everyone, irrespective of socio-economic status, enjoys fish in Zambia (FAO, 2006). Fish is also a major food item in the diet of Zambians (Mudenda., et al. (2005). It is an important food item in the Zambian diet, accounting for up to 55 percent of the national dietary animal protein (FAO, 2006). Although annual per capita consumption of fish has grown steadily in developing regions (from 5.2 kg in 1961 to 18.8 kg in 2013) and in low income food-deficit countries (LIFDCs) (from 3.5 to 7.6 kg), it is still considerably lower than that in more developed regions, even though the gap is narrowing (FAO, 2016).
The importance of fish in household food expenditure shows that with increasing levels of poverty the proportion of fish in household food expenditure also increases (FAO, 2006). Rural households account for 47 percent of fish consumption, followed by urban poor households (30 percent). However, in terms of agricultural and non-agricultural households, the latter demonstrate more than 50 percent of household expenditures for fish. Urban dwellers generally consume more fish than people in rural areas (FAO, 2006). Moreover, within the urban areas, the low-income stratum spends a greater proportion of household expenditure on fish because fish provides the cheapest source of animal protein (FAO, 2006).
Historically lakes and rivers in Zambia, which comprised 9 major fisheries (Kariba, Tanganyika, Itezhi-tezhi, Bangweulu, Mweru Luapula, Mweru wantipa, Kafue River, Zambezi River and Lukanga Swamps and minor fisheries such as Lusiwashi dam, Lower Zambezi and Chambeshi River) (ZDA, 2011), were considered limitless as they were thought to harbour fish to feed an ever increasing human population (Musumali., et al. 2009). The Zambian fisheries in the main lake areas are classified in two groups-the inshore fishery which mainly exploits the bream, and the pelagic fishery targeting Kapenta (SADC, 2016). All fishing activities are classified as being commercial, although separated into artisanal and recreational for management purposes (SADC, 2016). These fisheries cumulatively had more than 400 fish species, although only about 17 species could be considered commercial (ACF/FSRP, 2009).
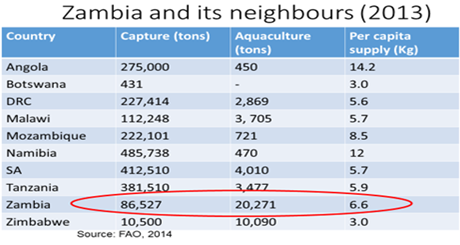
In Zambia, 106 798 tons of fish is produced annually (about 86,527 tons from capture fisheries and 20,271 tons from aquaculture), with the gross value add of USD147 million (SADC, 2016). The fisheries sector however, because of its mostly rural setting, continued to contribute significantly to rural development in terms of employment and income generation and reducing poverty (ZDA, 2011). The fisheries sector employs about 325,000 people (313,000 in capture fisheries and 12,000 in aquaculture) (SADC, 2016), deriving their livelihood directly as fishers and fish farmers, or indirectly as traders, processors and other service providers and it played a vital role in poverty reduction and rural economic growth (ZDA, 2011; GART, 2014). Fisheries contribute 1% to Zambia’s GDP (SADC, 2016).
Fish imports and exports
A sizeable and growing share of fish consumed in developed countries consists of imports, owing to steady demand and static or declining domestic fishery production (FAO, 2016). Fish remains among the most traded food commodities worldwide (FAO, 2014). Zambia imports and has been importing fish for culture and for consumption since 1980’s (FAO, 2006). The country imports between: 4,626 and 16, 077 tonnes of fish annually from neighbouring countries such as Zimbabwe, Mozambique and Namibia (Lusaka Times, 2013). The demand for fish by an ever-growing population in the country had been overwhelming and could not be sustained by the yields of the natural water bodies, such as lakes and rivers alone (Musumali., et al. 2009), but also from imports, since aquaculture made an insignificant contribution towards the annual fish production in Zambia.
A sizeable and growing share of fish consumed in developed countries consists of imports, owing to steady demand and static or declining domestic fishery production (FAO, 2016). Fish remains among the most traded food commodities worldwide (FAO, 2014). Zambia imports and has been importing fish for culture and for consumption since 1980’s (FAO, 2006). The country imports between: 4,626 and 16, 077 tonnes of fish annually from neighbouring countries such as Zimbabwe, Mozambique and Namibia (Lusaka Times, 2013). The demand for fish by an ever-growing population in the country had been overwhelming and could not be sustained by the yields of the natural water bodies, such as lakes and rivers alone (Musumali., et al. 2009), but also from imports, since aquaculture made an insignificant contribution towards the annual fish production in Zambia.
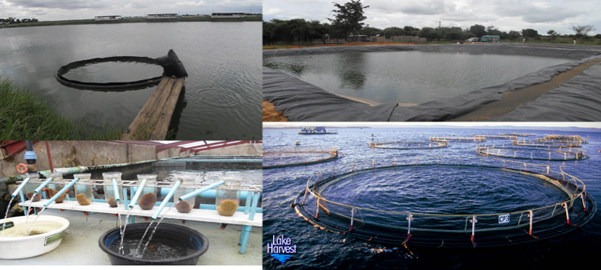
Aquaculture is in its infant stage of development in Zambia, but has shown tremendous growth (SADC, 2016). Aquaculture also plays a role in food security through the significant production of some low-value freshwater species, which are mainly destined for domestic production, also through integrated farming (FAO, 2014). The development of National Aquaculture Development Plan in 2010 attracted investment into the aquaculture sub-sector. As a result of the plan, aquaculture production increased rapidly from 2010 to 2015 (SADC, 2016). Availability of land and water is another possible main constraint to aquaculture growth (FAO, 2014). However, in Zambia there was no shortage of land or water for doing aquaculture. In fact, aquaculture was operated at two levels: land based (i.e. use of ponds and tanks with and without recirculatory system) and cage aquaculture (Musuka and Musonda, 2012).
The cultivation of fish in Zambia was mostly centred on Oreochromis niloticus, Oreochromis andersonii, Oreochromis macrochir and Tilapia rendalli to some extent (Musuka and Musonda, 2012).
Sizes of most of the open ponds used for fish production ranged from as small as 625m2 to as big as 10,000m2 (ha). However, nursery ponds were much smaller than those. In the same vein, the commonly used open cages were those fitted with metal frames, whose dimension was 216m3 and the PVC circular type, whose diameter ranged between 15m and 30m respectively. Meanwhile, the size of hatchery facilities dependent on the individual investment put in and the expected number of fry to be produced in a given period. Most hatcheries were not more than 24m2, since soon after the yolk absorption, the fry was normally relocated to nursery ponds.
The scope of this research focused on the contribution of fish imports to meet the ever growing demand of Zambian populous, with respect to the specific species and the amount in metric tonnes per year. It further analysed the extent to which imported fish helped in meeting the ever increasing demand for the product in Zambia.
Materials and Methods
Data Collection
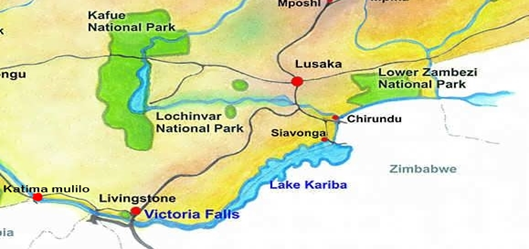
The selection of study areas was based on the anticipated high level of fish imports coming in through Chirundu and Katima Mulilo border posts in the Southern part of Zambia [Figure 1]. Meanwhile, secondary data was obtained from published literature, which included journal articles, internet and government reports.
The selection of study areas was based on the anticipated high level of fish imports coming in through Chirundu and Katima Mulilo border posts in the Southern part of Zambia [Figure 1]. Meanwhile, secondary data was obtained from published literature, which included journal articles, internet and government reports.
Results
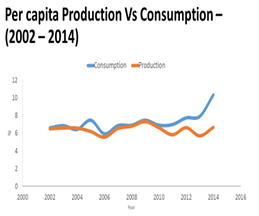
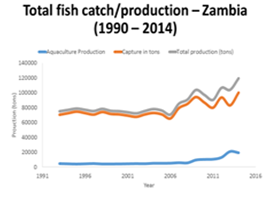
Figure 3 reveals a big contrast between per capita production and per capita consumption of fish. In the same vein, Figure 4 shows total fish production from both capture and aquaculture. The red mark gives an indication of a projected drop in fish production from the natural water bodies as well as an anticipated increase in fish production from aquaculture over the last twelve years in Zambia.
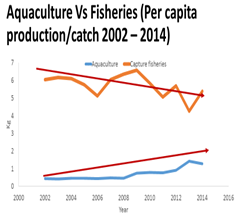
Figures 5 and 6 show fish supply, aquaculture versus capture fisheries per capita catch/production between 2002 and 2014.
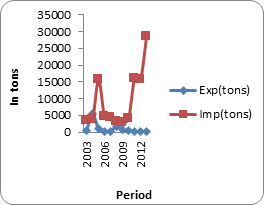
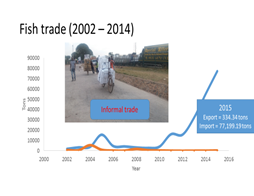
Figures 7 and 8 showing imports, exports trends as well as various types of imported fish.
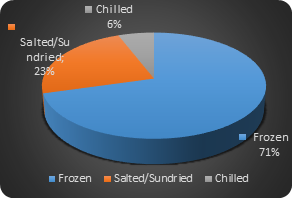
Figure 9 showing cross border fish trading, while Figure 10 reveals types of preservation methods used on imported fish in order to prolong their shelf life.
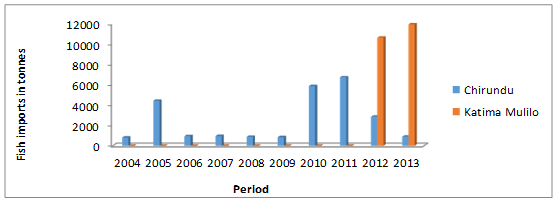
Figure 11 shows a comparison of fish imports through Chirundu and Katima mulilo.
Discussion
Fish and fishery products play a critical role in global food security and nutritional needs of people in developing and developed countries (FAO, 2014). Delgado., et al. (2003), further reported that global consumption of fish as food had doubled since 1973, and the developing world had been responsible for over 90 per cent of that growth. Fish is a traditional part of Zambian diet. Compared to many other countries, Zambians have a distinctive preference for fish compared to other forms of essential protein such as beef or chicken (Piers, 2017). Fish consumption among Zambians has increased tremendously [Figures 3 and 4] and the current supply does not meet the domestic demand, which has resulted in the dependence on imported fish and therefore required little additional effort (ZDA, 2011).
Fish and fish products account for a large proportion of our animal protein intake and provide essential micronutrients to the majority of Zambia’s population who are highly vulnerable to malnutrition (Piers, 2017). The consumption of fish on a per capita basis [Figure 3] is decreasing as the population increases e.g. the per capita consumption was 12.1 kg in 1970; 8.3 kg in 1990; 6.8 kg in 1997 and 6.2 kg in 2000 (Mudenda., et al. 2005); and now somewhere around 7 kg person for many years (ACP-Fish II 2008). As a result Zambians are now eating less and less of fish due to low production (Piers, 2017). Despite the overall increase in the availability of fish to most consumers, growth patterns of per capita apparent fish consumption have been uneven (FAO, 2014). For example, it has remained static or decreased in some countries in sub-Saharan Africa (e.g. the Congo, Gabon, Liberia, Malawi and South Africa) and, albeit from a high level, in Japan in the last two decades, while growing most substantially in East Asia (from 10.7 kg in 1961 to 35.4 kg in 2010), Southeast Asia (from 12.8 to 33.4 kg) and North Africa (from 2.8 to 12.2 kg) (FAO, 2014).
The recently released seventh national development plan (SNDP, 2017) report attributed the Zambian capture fisheries sub-sector poor performance to increase in the number of fishers, most of who brought in the use of destructive fishing methods; that resulted in the decline in the quantities of harvested fish.
It has been reported that there was an increase of 20 per cent in capture fisheries, from 69,364 in 2011 to 83,719 metric tonnes in 2015 (SNDP, 2017). Similarly, ACF/FSRP (2009) and GART (2014) reported that natural fisheries contributed 90% fish production of the average 70,000 to 85,000 metric tonnes in recent past with the other 10% coming from fish farming. There has been a number of donor supported aquaculture development programmes targeting smalls-scale farmers, which has led to increased and adoption of the practice in various parts of the country (SADC Fact Sheet, 2016).
There is therefore a strong recognition by government that aquaculture can and should play an important role in terms of food security, nutrition and income generation (Ngosa, 2010).
Aquaculture potential to increase fish availability in Africa Aquaculture has great potential to help meet fish demand (FAO, 2014). The production from aquaculture, which has since increased from 4,500 metric tonnes in 2003, 5000 metric tonnes in 2006 to 20,917 tonnes in 2013 [Figure 5] and 22,700 metric tonnes in 2015 (SNDP, 2017), representing a 340 per cent increase. This increase is however, considered to be very low when compared with enormous opportunities and potential to increasing production 10-fold in existing aquaculture facilities (i.e. ponds, community small water bodies (SWBs) and cages) by expanding into new areas (DoF, 2010; Musuka and Musonda, 2013). This deficit provides room for flourishing fish farming industry in Zambia as there is guaranteed market in the country and the sub-region for fish and fish products. It also has the potential to create employment and contribute to increased incomes for households as well as to overall GDP (SNDP, 2017).
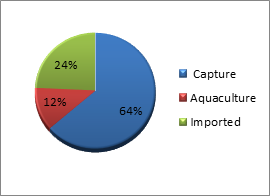
Despite an average total annual production having increased [Figure 5], Zambia still imports up to 12% of all the fish consumed in the country [Figure 6]. The gap between supply and demand was foreseen to increase further as a result of fish’s nutritional content, low productivity from capture fisheries and aquaculture, and population increase (ZDA, 2011).
The national demand for fish had increased to over 140,000 tonnes per year and the supply stood at 120,000 tonnes (ACF/FSRP, 2009; ZDA, 2011). Meanwhile, the current estimate of catch/production of fish stands at 95, 000 metric tonnes, while the official fish requirement for Zambia stands at over 186,000 tonnes and the country has an annual deficit of between 40,000 and 74,000 metric tonnes (SNDP, 2017; Ralte, 2017).
Results of this study further showed that there was a very big contribution made by imported fish in trying to meet the demand for fish in Zambia. It was very clear that the demand for fish was very high and fish imports had increased tremendously since 2010, peaking at 30,000 metric tonnes in 2013 [Figure 7]. However, drastic drops of imports were recorded between 2006 and 2010 that could partly be attributed to increases in local fish production. The markets became flooded, thus recording a slump in fish imports. Ayoola, 2010; Falaye and Akinyemi, 1990, suggested that the yearly shortfall in demand and supply of fish coupled with high cost of possible substitute for fish such as meat and beef showed that there was steady market for fish. FAO (2006) observed that the domestic fish market was still a sellers’ market and therefore required little additional effort. FAO (2016), also reported that an important share of fishery trade consists of high-value species, such as salmon, shrimp, tuna, ground fish, bass and bream. However, some high-volume, but relatively low-value, species were also traded in large quantities not only nationally, but also at the regional and international level (FAO, 2016). For example, small pelagics are traded in large quantities, mainly being exported to low-income consumers in developing countries. However, emerging economies in developing countries have increasingly are also importing species of higher value for their domestic consumption (FAO, 2016).
Zambia was importing fish from neighbouring countries such as Zimbabwe, Mozambique and Namibia and elsewhere in the world through individuals and companies based in Lusaka (Capital Fisheries, in Onambango Group LTD, Goldfish Investment, Liberty, Suhalls International Ltd, Chinkwe General Dealers, C.A. Estates Ltd, Tricon Ltd, Blue Wave Investment, Quiwha Investment), Copperbelt (Nyambi General, Deep Catch trading, Andy’s Fish Centre, Sea food busket, Good faith) and Kasumbalesa-Zambian side (Pindol Enterprise and Muchi General Dealers). Meanwhile some of the exporters of fish to Zambia included: Sino Africa-Namibia, ESJA Fishing (PTY) Ltd, Insung Fishing (PTY) Ltd, Erongo Marine Enterprises, Namibia Fishmeal Processors, Gendev of Namibia Ltd, Bluewave sea products, Atlantic Pacific Fishing PTY LTD, AB Food Products CC, Cortex Products & Trade CC, Omalu Blue sea Joint, Omualu Fishing (pty), Yunah New ocean LTD, Eastline-Namibia, Heridian Sea Products CC, Meridian Sea Products CC, Coridors Logistics-Namibia and Namibian open Market from Namibia, Ocean Bay International Ltd, Gallant Ocean Int. Hegui, Industrial District, Foshan City, from China, Unifoods Southern Africa Pty and Vestey Foods Int'nal, from the United Kingdom.
The species of fish imported included: Common carp, Nile tilapia, Three Spotted Tilapia, Red-Breasted Tilapia, Mackerel, Live Ornamental fish, Kapenta, Salmonidae and catfish (FAO, 2006). According to FAO (2016), the distribution of frozen aquaculture products has also expanded dramatically, facilitated by increased volumes and much-reduced transportation costs. One example is the success of frozen whole tilapia and catfish from Asia, which have gained access to new markets in all regions of the world. FAO (2014), has been suggested that exports from developing countries had increased significantly in recent decades also thanks to the lowering of tariffs, in particular for non-value added products.
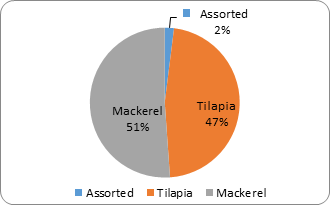
In this study, it was observed that more frozen Mackerel was being imported into the country than other species [Figure 8]. Mackerel contributed about 51%, Tilapia 47%, and others making up the remaining 2% of the total frozen imports. Fish such as Mackerel in particular, was being imported cheaply into Zambia to be sold profitability elsewhere [Figures 8 and 9]. It may be speculated that the importation of Mackerel was not meant for the Zambian market, considering that Zambia fresh fish dishes were synonymous with Tilapia species. Mudenda., et al. (2005) who reported that in Zambia, the fish market was dominated by the Tilapia (bream species), which accounts for 60 % of total supply on the market.
According to Anon, 2013 the cumulative totals indicate that 10,846 tonnes was imported from Zimbabwe, 6,196 tonnes from China, 6,073 tonnes from Namibia and 4,732 tonnes from Mozambique. However, fish imports from 2006 to 2013 fluctuated between 4,626 and 28,666 tonnes (Musumali., et al. 2009; ZDA, 2011; Lusaka Times, 2013; DoF, 2013; Musuka and Musonda, 2013). This was in agreement with CSO SUN (2014) who reported that the Department of Fisheries recorded that in 2012, Zambia imported 15,988 Metric tonnes of fish, and 28,666 Metric tonnes in 2013, almost a double increase. FAO (2014), reported that fish prices were influenced by demand and supply factors, including the costs of production and transportation, but also of alternative commodities, including meat and feeds. Many millions of people around the world find a source of income and livelihood in the fisheries and aquaculture sector.
The study also revealed various forms of fish preservation methods used to prolong their shelf life, of which the largest amount consisted of the frozen, followed by salted and sundried and then chilled ones (Figure 10). This finding was in agreement with FAO (2006) who reported that fish was processed and distributed in various forms: fresh, salted, smoke-dried, sun-dried, frozen and filleted. There was also processing for ornamental purposes. Almost all fish produced in the country was intended for human consumption and rarely was any fish processed into fishmeal for the production of animal feed (FAO, 2006).
Market facilitation operations were still undeveloped in Zambia due to orientation of production to domestic demand (FAO, 2006). A few species (Mackerel and various tilapia species, especially Nile tilapia), which were on demand came in larger quantities (FAO, 2006). More than 50% of fish imports, especially those from China were gutted and filleted fresh tilapias (breams), packaged in 50 kg boxes (Musuka and Musonda, 2013). Small fish of about 50g to 100g were mostly on demand in places of high population density, such as Chisokone market in Kitwe on the Copperbelt and Soweto market in Lusaka. However, it was different for places of low population density like Woodlands in Lusaka and Kansenji in Ndola, where the size on demand was between 200g to 1000g. Nationally, valuable markets were found in Central, Copperbelt, Eastern and Lusaka provinces, as those had huge, dense populations (FAO, 2006), where the imported fish was distributed through a variety of outlets, including: wholesale and retail stores selling meat and other food products and super market throughout the country (Fisheries Sector, 2006).
From the two entry points where data was collected, results indicated that there was a reduction in teams of imports coming through Chirundu [Figure 11], probably because importers were using Siavonga as an alternative route although the Department of Fisheries there was not active in terms of fish imports data collection. However, Katima-Mulilo in Sesheke, which became active in 2012, was doing very fine in terms of fish imports. But information on fish imports through Katima Mulilo was limited to a period of one year. However, Zambia imports a considerable amount of fishmeal products from Namibia and other exotic fishes, mostly crustaceans for the domestic high income market (Mudenda., et al. 2005).
A substantial amount of money was being spent to import fish into Zambia. According to Mulenga (2017), Zambia’s Minister of Fisheries and Livestock, Michael Katambo indicated that Zambia had a staggering bill of nearly K4 billion for importing fish to offset the national deficit. At a very conservative price estimate of US$ 2-00 per Kg, that meant Zambia was paying over eighty million US dollars to import additional fish requirements from other countries; thus spending such amounts in foreign exchange when the country had some of the best water resources in Africa (Piers, 2017).
With an estimated 40,000 ha, Zambia could be brought under pond culture and further million hectares of land from lake areas was potentially suitable for aquaculture use (DoF, 2010; Musuka and Musonda, 2013). The country had the potential to produce more fish on a sustainable basis with the development of aquaculture and rational management of capture fisheries (FAO, 2006). From aquaculture the country could produce enough fish domestically to feed its population and provide employment to thousands of people currently unemployed (Piers, 2017).
Although, fish was being imported into Zambia, the country had in the same vein recorded exports of both edible and ornamental fish to other countries [Figure 9]. Exports in limited quantities were usually carried out by individuals for target markets (FAO, 2006; ZDA, 2011). Since health and safety requirements for exports to regional and other fish markets were not restrictive, anyone with cold storage, packaging and transportation facilities could export (FAO, 2006).
Regional destination markets for Zambian fish, mostly for consumption included: Botswana, Democratic Republic of Congo, Republic of South Africa and Zimbabwe (FAO, 2006; ZDA, 2011). It may be speculated that imported fish such as Mackerel may have been re-exported to Congo Democratic Republic. At international level, and specific to live fish for ornamental purposes, the common destinations were Belgium, Canada, Denmark, UK, Germany, Russia, Sweden and the United States of America (FAO, 2006; ZDA, 2011).
Conclusion
Zambia imports a lot of fish from some of its neighbours and elsewhere in the world, through individuals and companies based in Lusaka and the Copperbelt Provinces, through Chirundu, Katima Mulilo in Sesheke and elsewhere, which contribute tremendously towards meeting the everyday demand of fish by the country’s populace. It was also observed that much more frozen Mackerel was being imported into the country than other species which was meant for the Congo market. However, small sized fish of about 50g to 100g were mostly on demand in places of high population density, on the Copperbelt and in Lusaka, while in places of low population density the size on demand was between 200g to 1000g.
These imports cost Zambia a lot of money. To date imports have gone up five-fold over the last six to ten years. Just as so much fish was being imported into Zambia, the country had in the same vein recorded exports of both edible and ornamental fish to other countries where it earns some foreign exchange.
References
- ACF/FSRP, and World Fish center. “The status of the population in Zambia's waters. Conference proceedings” (2009):
- ACP-Fish II. “Country Profile: Zambia” (2008).
- “Agriculture, Livestock and Fisheries”. Zambia Agriculture Sector Profile.12. (2011):
- Ayoola SO. “Sustainable fish production in Africa”. African Journal of Food Agriculture, Nutrition and Development 10.5 (2010): 1-9.
- Delgado CL., et al. “Fish to 2020: Supply and Demand in changing Global Markets”. International Food Policy Research Institute (2003):
- Falaye AF and Akinyemi O. “Aquaculture in Nigeria. Longman Press, Ibadan”. (1990): 90.
- Food and Agriculture Organization (FAO). “The state of world fisheries and Aquaculture. Report”. (2004):
- FAO Aquaculture production. “The State of World Fisheries and Aquaculture. FAO Fisheries Country Profile-The Republic of Zambia” (2006).
- FAO. “The State of World Fisheries and Aquaculture 2014. Rome”.
- FAO. “The State of World Fisheries and Aquaculture 2016. Contributing to food security and nutrition for all. Rome”.
- GART Research Centre. “The Future of Zambian Agriculture. Chisamba, Zambia”. (2014):
- Anon. “Zambia imports lots of fish from neighbours”. Lusaka Times (2013):
- Mudenda HG., et al. “Intensification and Commercialisation of Aquaculture in ASP Areas”. (2005): 121.
- Mulenga D. “Whopping K4 billion fish import bill for Zambia. Zambia”. Dail Mail(2017):
- Musumali MM., et al. “Fisheries in Zambia: An undervalued contributer to poverty reduction”. (2009):
- The world fish center/the World Bank policy brief 1913.
- Musuka CG and Musonda FF. “Contribution of small water bodies and small-holder aquaculture towards poverty alleviation and enhancing household food security in Zambia”. International Journal of Fisheries and Aquaculture 5.11 (2013): 295-302.
- Ngosa S. “Demand for domestic fish consumption outrips production”. (2010):
- Piers A. “Why is Zambia importing 40,000 tons of fish every year?” Lusaka Times (2017):
- Ralte R. “ZAMBIA - The Zambian government has announced the start of a fish farming project aimed at boosting the production of fish for both local consumption and export”. Environment Sustainability Post-harvest Processing Economics (2017):
- SADC. “SADC Fisheries Fact Sheet”. 1.2 (2016):
- SNDP. “Seventh National Development Plan (SNDP), 2017-2021”. Ministry of National Development Planning. Lusaka. Zambia (2017):
- Zambia Civil Society Scaling up Nutrition (CSO-SUN). “CSO SUN calls for the development of the fisheries sector for improved nutrition”. (2014):
- Zambia Daily Mail. “Aquaculture production to increase in Zambia”. (2012):
- Zambia Development Agency (ZDA). “Zambia Agriculture Sector Profile. Agriculture, Livestock and Fisheries Sector Profile”. (2011): 21.
Citation:
Confred G. Musuka., et al. “Fish Imports and Their Contribution towards Feeding an Ever-Growing Population in Zambia”.
Innovative Techniques in Agriculture 1.2 (2017): 107-115.
Copyright: © 2017 Confred G. Musuka., et al. This is an open-access article distributed under the terms of the Creative Commons Attribution License, which permits unrestricted use, distribution, and reproduction in any medium, provided the original author and source are credited.


 Scientia Ricerca is licensed and content of this site is available under a Creative Commons Attribution 4.0 International License.